Note
Click here to download the full example code
Loading a TLE catalog
Out:
  oid            a           e        i     mjd0            m         d    BSTAR
-----  -----------  ----------  -------  -------  -----------  --------  -------
    5  8.62529e+06  0.185229    34.2637  59099.3  8.30609e+10   3165.75        0
   11  8.12965e+06  0.147491    32.8827  59100    2.0944           0.2         0
   12  8.32326e+06  0.166034    32.9126  59099.9  1.1739e+10    1649           0
   16  8.82132e+06  0.201469    34.282   59099.7  1.59826e+13  18276.5         0
   20  8.2694e+06   0.167131    33.3587  59099.5  1.58019e+10   1820.74        0
   22  6.96617e+06  0.012802    50.3036  59099.9  1.38467e+12   8087.1         0
   29  7.03155e+06  0.00130333  48.398   59099.8  1.32167e+13  17154.7         0
   45  7.16368e+06  0.0252182   66.7081  59099.9  1.00264e+13  15645.6         0
   46  7.11232e+06  0.021404    66.7043  59099.9  1.71486e+12   8684.67        0
   47  7.13579e+06  0.0223744   66.6787  59099.8  6.36882e+12  13449.2         0

 Orbit of satnum: 329
a    : 7.3867e+06   x : 2.8596e+06
e    : 5.7751e-01   y : -2.0020e+06
i    : 6.8867e+01   z : 6.5599e+06
omega: 3.4308e+02   vx: 7.0105e+03
Omega: 1.9159e+02   vy: 6.7702e+02
anom : 5.7506e+01   vz: 1.9273e+03


Space object 329: <Time object: scale='utc' format='mjd' value=59100.22859376995>:
('1   329U 61015DF  20252.22859377 -.00000018  00000-0  63745-4 0  9990', '2   329  66.7785 271.2226 0119721 314.2276 118.4865 13.65287519942659')
Parameters: C_D=2.3, m=102726828682.2335, C_R=1.0, d=3398.117705962821
/home/danielk/venvs/sorts/lib/python3.7/site-packages/astropy/coordinates/builtin_frames/utils.py:76: AstropyWarning: (some) times are outside of range covered by IERS table. Assuming UT1-UTC=0 for coordinate transformations.
  warnings.warn(msg.format(ierserr.args[0]), AstropyWarning)
/home/danielk/venvs/sorts/lib/python3.7/site-packages/astropy/coordinates/builtin_frames/utils.py:62: AstropyWarning: Tried to get polar motions for times after IERS data is valid. Defaulting to polar motion from the 50-yr mean for those. This may affect precision at the 10s of arcsec level
  warnings.warn(wmsg, AstropyWarning)
import pathlib
import matplotlib.pyplot as plt
import numpy as np
import sorts
from sorts import plotting
from sorts.population import tle_catalog
try:
pth = pathlib.Path(__file__).parent / 'data' / 'tle.txt'
except NameError:
import os
pth = 'data' + os.path.sep + 'tle.txt'
pop = tle_catalog(pth, kepler=True)
print(pop.print(n=slice(None,10), fields = ['oid','a','e','i','mjd0', 'm', 'd', 'BSTAR']))
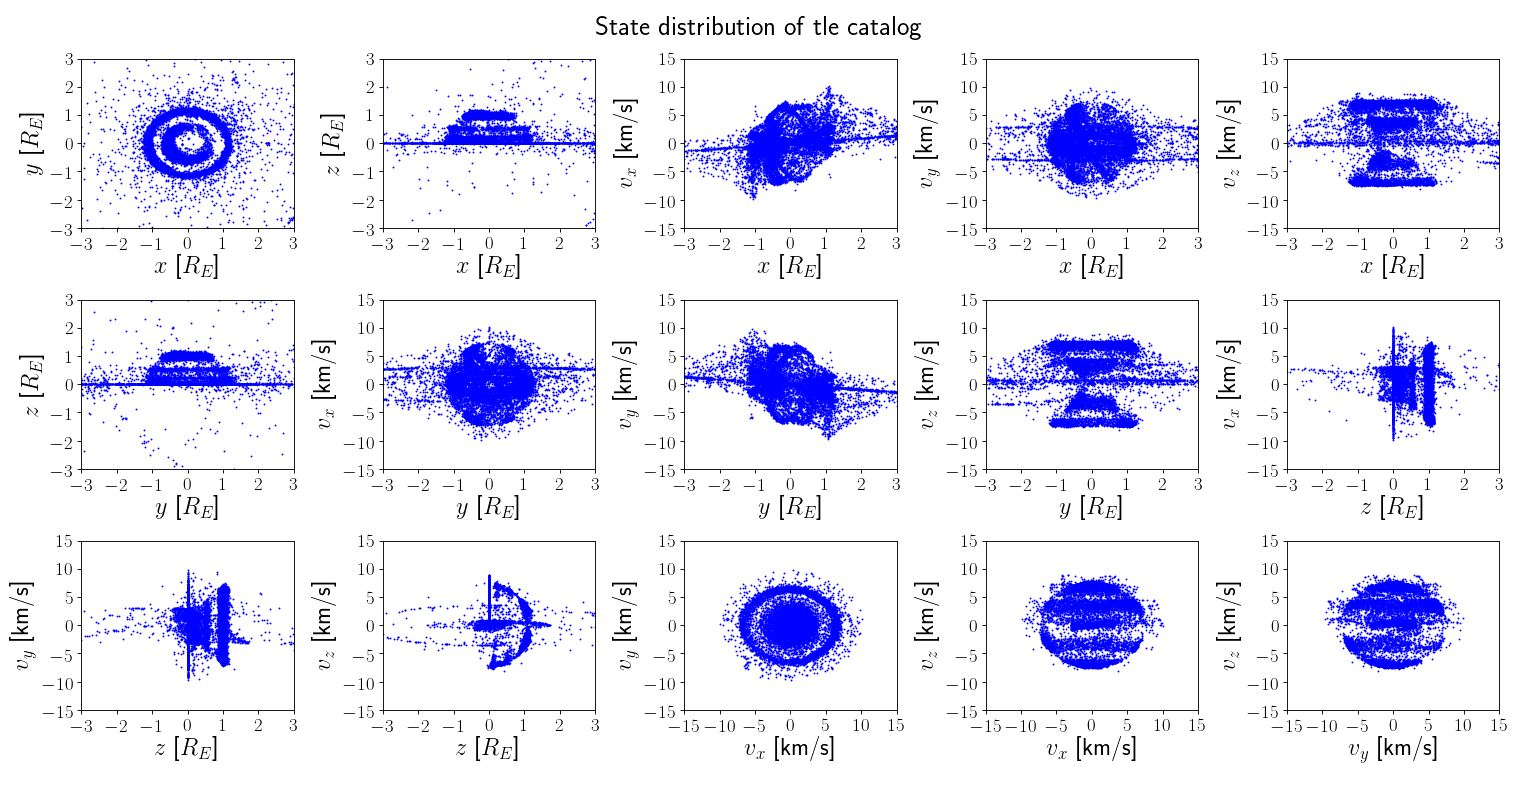
plotting.orbits(
pop.get_fields(['x','y','z','vx','vy','vz'], named=False),
title = "State distribution of tle catalog",
axis_labels = 'earth-state',
limits = [(-3,3)]*3 + [(-15,15)]*3,
)
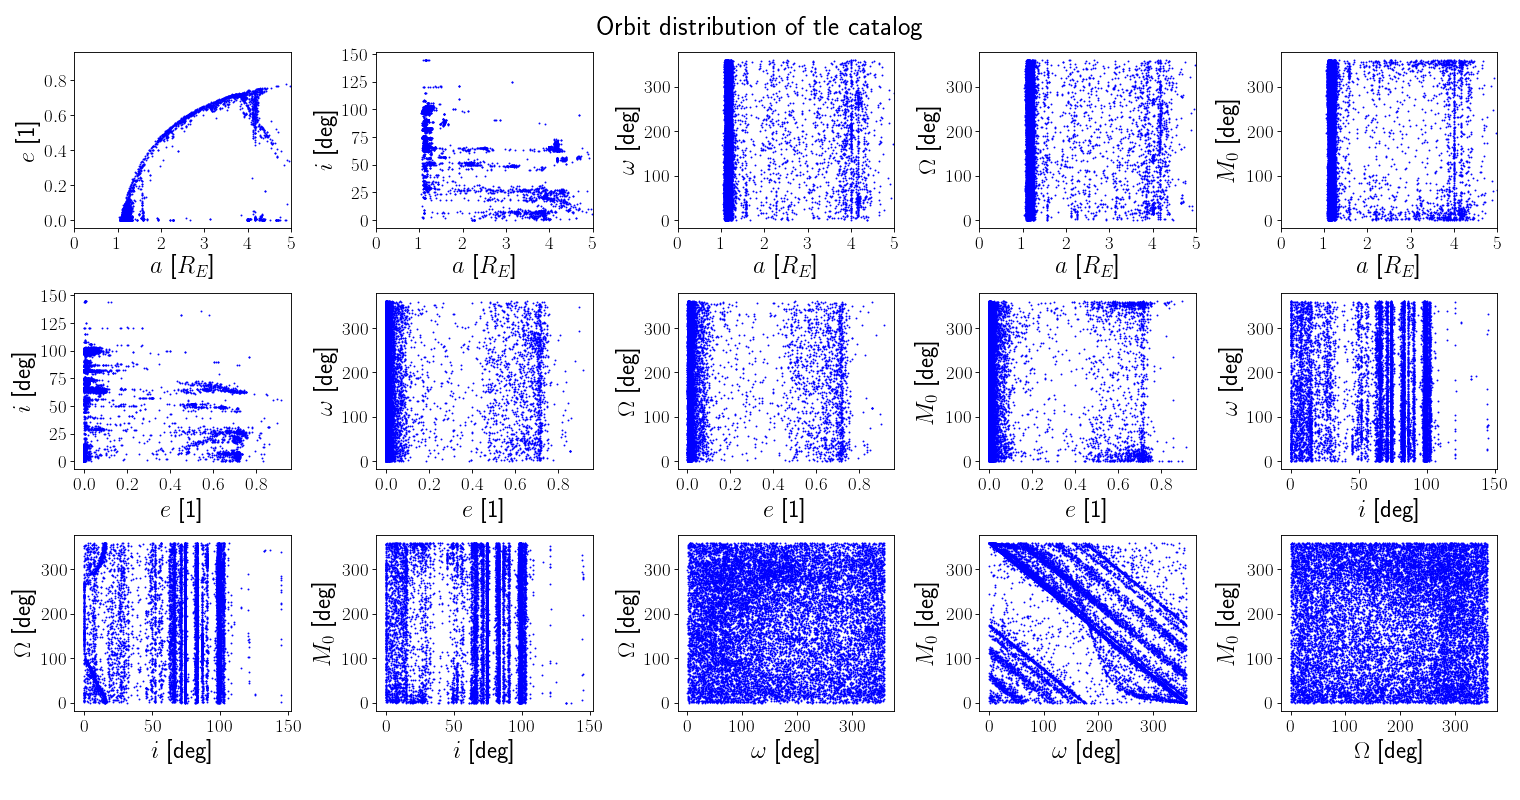
plotting.orbits(
pop.get_fields(['a','e','i','aop','raan','mu0'], named=False),
title = "Orbit distribution of tle catalog",
axis_labels = 'earth-orbit',
limits = [(0, 5)] + [(None, None)]*5,
)
#look at kepler elements
orbit = pop.get_orbit(n=101, fields = ['x','y','z','vx','vy','vz', 'm'])
print(f'\n Orbit of satnum: {pop["oid"][101]} \n{str(orbit)}\n')
#we can also create a space object
obj = pop.get_object(n=101)
print(obj)
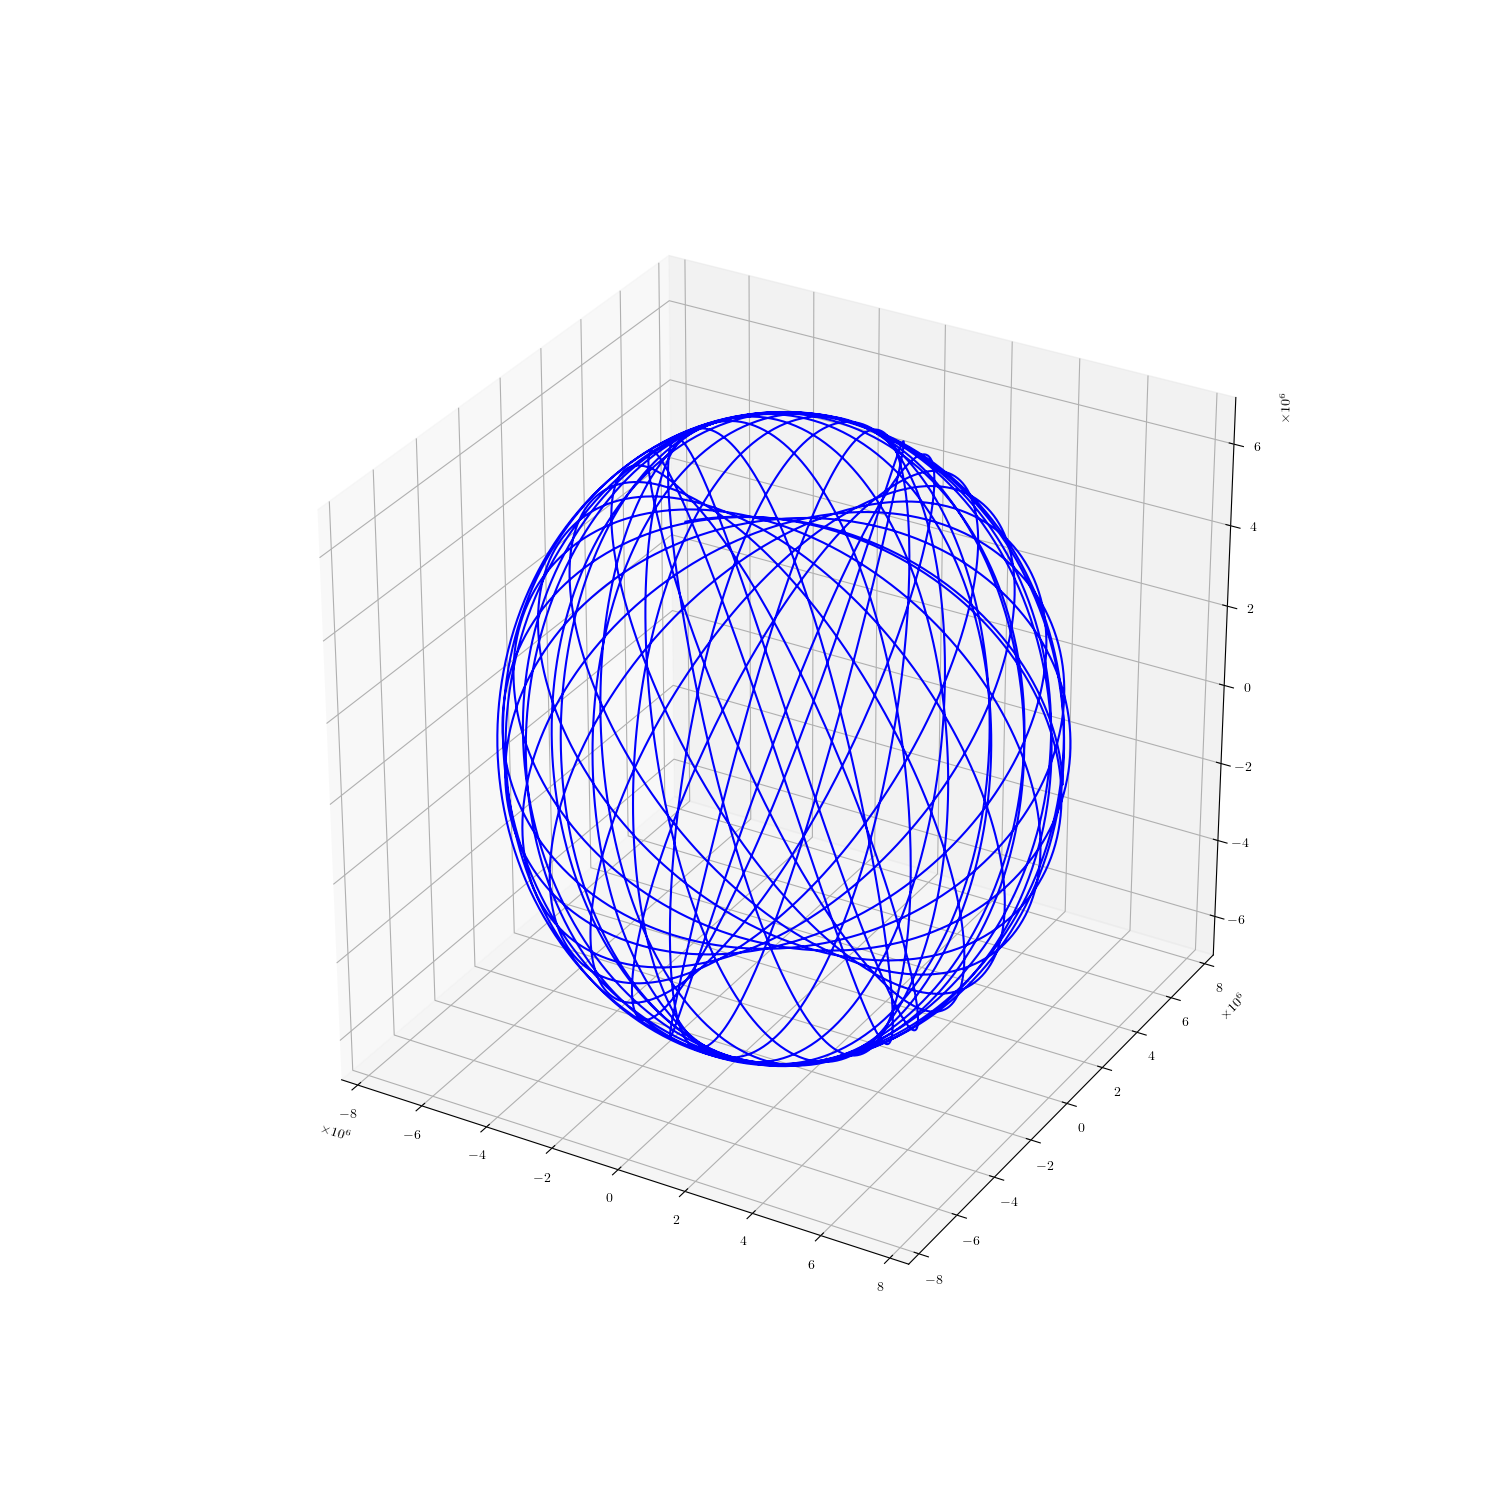
#lets get ITRS states
obj.propagator.set(out_frame='ITRS')
t = np.linspace(0,3600*24.0*2,num=5000)
states = obj.get_state(t)
fig = plt.figure(figsize=(15,15))
ax = fig.add_subplot(111, projection='3d')
ax.plot(states[0,:], states[1,:], states[2,:],"-b")
plt.show()
Total running time of the script: ( 0 minutes 20.413 seconds)