Note
Click here to download the full example code
Finding passes over radar system
Out:
a    : 7.2000e+06   x : -1.2919e+06
e    : 5.0000e-02   y : 2.4776e+06
i    : 7.5000e+01   z : 6.4974e+06
omega: 0.0000e+00   vx: -2.0314e+03
Omega: 7.9000e+01   vy: -6.8229e+03
anom : 7.2000e+01   vz: 2.5835e+03
Temporal points: 675849
Pass Station [0, 0] | Rise 0:00:00.127839 (3.4 min) 0:03:23.264533 Fall
Pass Station [0, 0] | Rise 1:42:08.745262 (4.8 min) 1:46:58.045663 Fall
Pass Station [0, 0] | Rise 3:26:18.937886 (4.8 min) 3:31:06.704215 Fall
Pass Station [0, 0] | Rise 5:09:51.673586 (5.9 min) 5:15:47.578278 Fall
Pass Station [0, 0] | Rise 6:53:14.437819 (6.2 min) 6:59:27.984338 Fall
Pass Station [0, 0] | Rise 23:40:05.679676 (5.0 min) 23:45:07.764010 Fall
import numpy as np
import matplotlib.pyplot as plt
import pyorb
import sorts
eiscat3d = sorts.radars.eiscat3d
from sorts.propagator import SGP4
Prop_cls = SGP4
Prop_opts = dict(
settings = dict(
out_frame='ITRS',
),
)
prop = Prop_cls(**Prop_opts)
orb = pyorb.Orbit(M0 = pyorb.M_earth, direct_update=True, auto_update=True, degrees=True, a=7200e3, e=0.05, i=75, omega=0, Omega=79, anom=72, epoch=53005.0)
print(orb)
t = sorts.equidistant_sampling(
orbit = orb,
start_t = 0,
end_t = 3600*24*1,
max_dpos=1e3,
)
print(f'Temporal points: {len(t)}')
states = prop.propagate(t, orb.cartesian[:,0], orb.epoch, A=1.0, C_R = 1.0, C_D = 1.0)
passes = eiscat3d.find_passes(t, states)
for ps in passes[0][0]: #tx-0 and rx-0
print(ps)
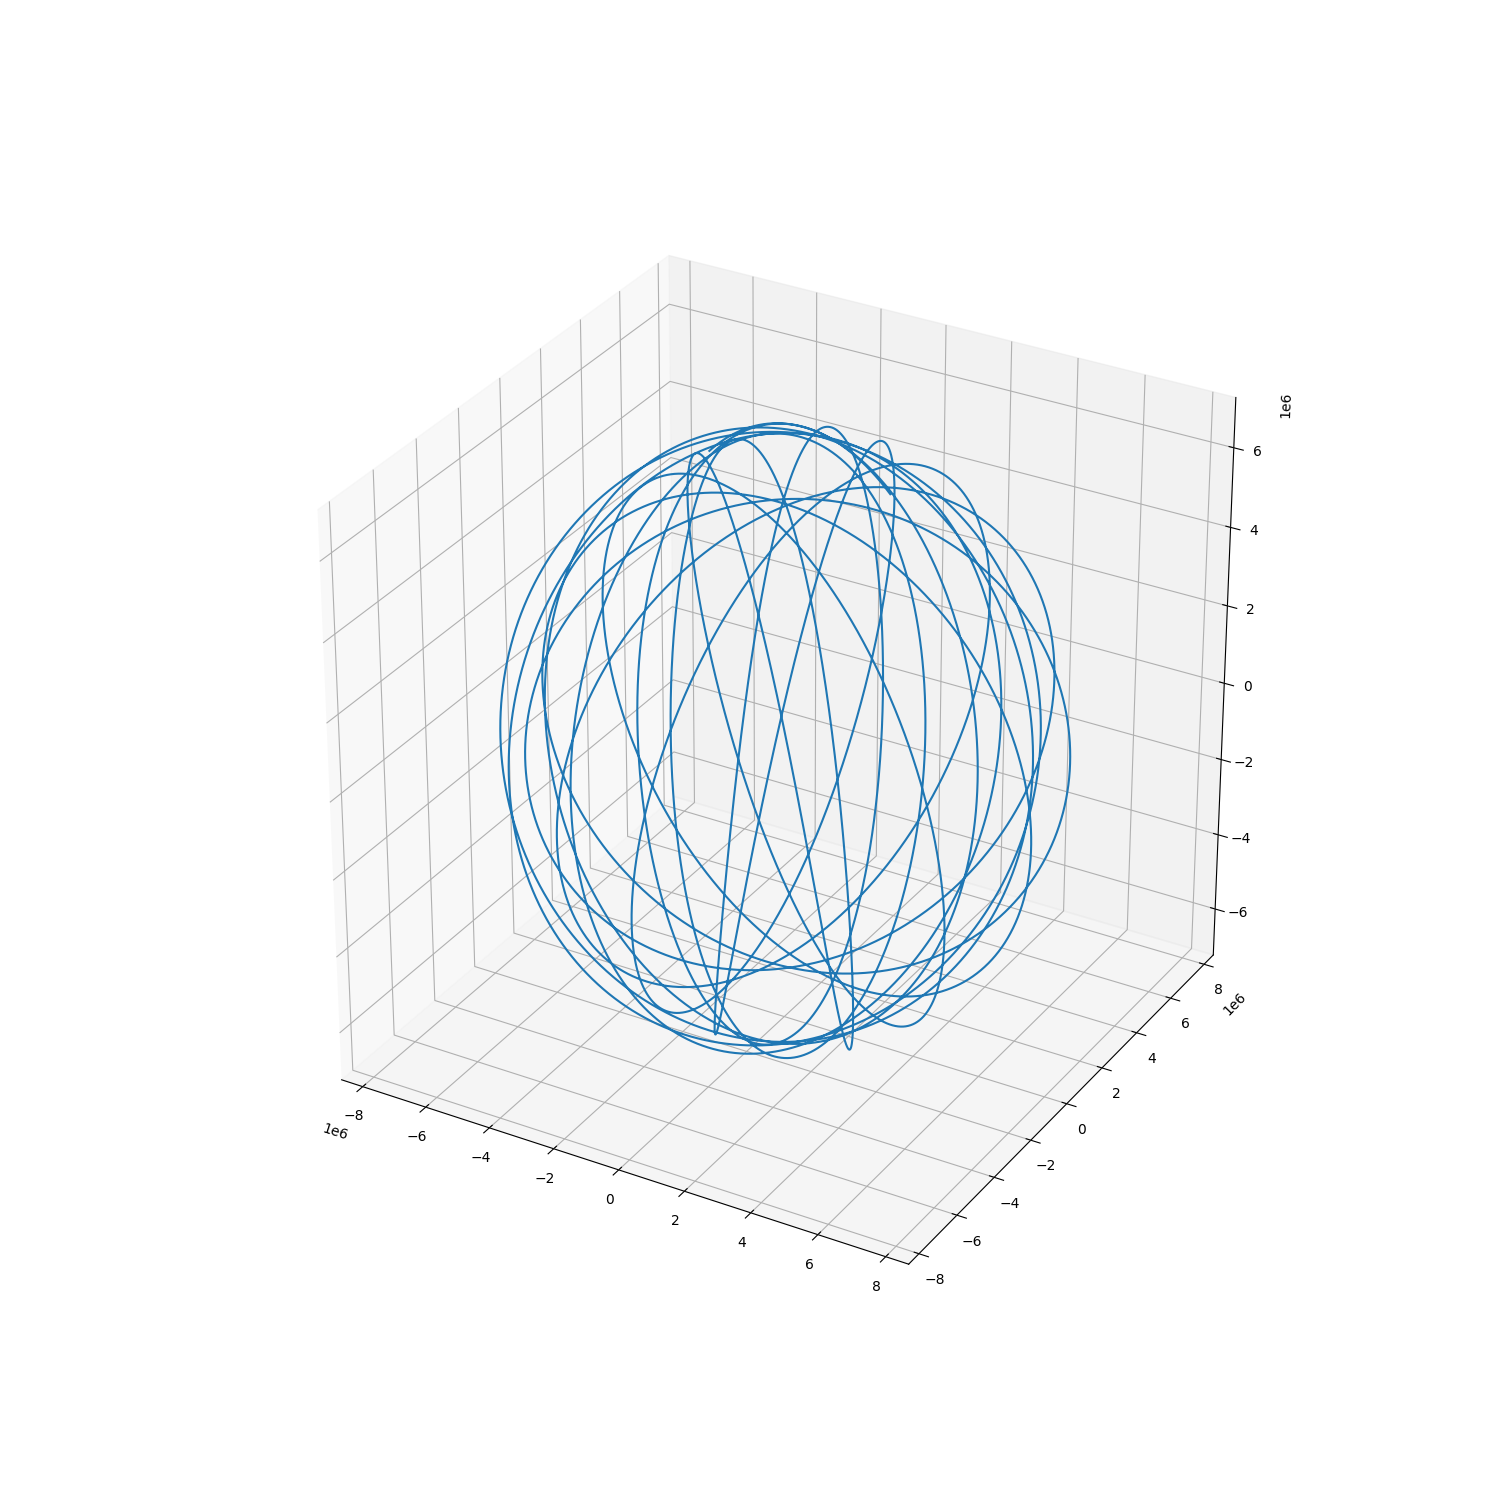
fig = plt.figure(figsize=(15,15))
ax = fig.add_subplot(111, projection='3d')
ax.plot(states[0,:], states[1,:], states[2,:])
fig = plt.figure(figsize=(15,15))
axes = [
[
fig.add_subplot(221, projection='3d'),
fig.add_subplot(222),
],
[
fig.add_subplot(223),
fig.add_subplot(224),
],
]
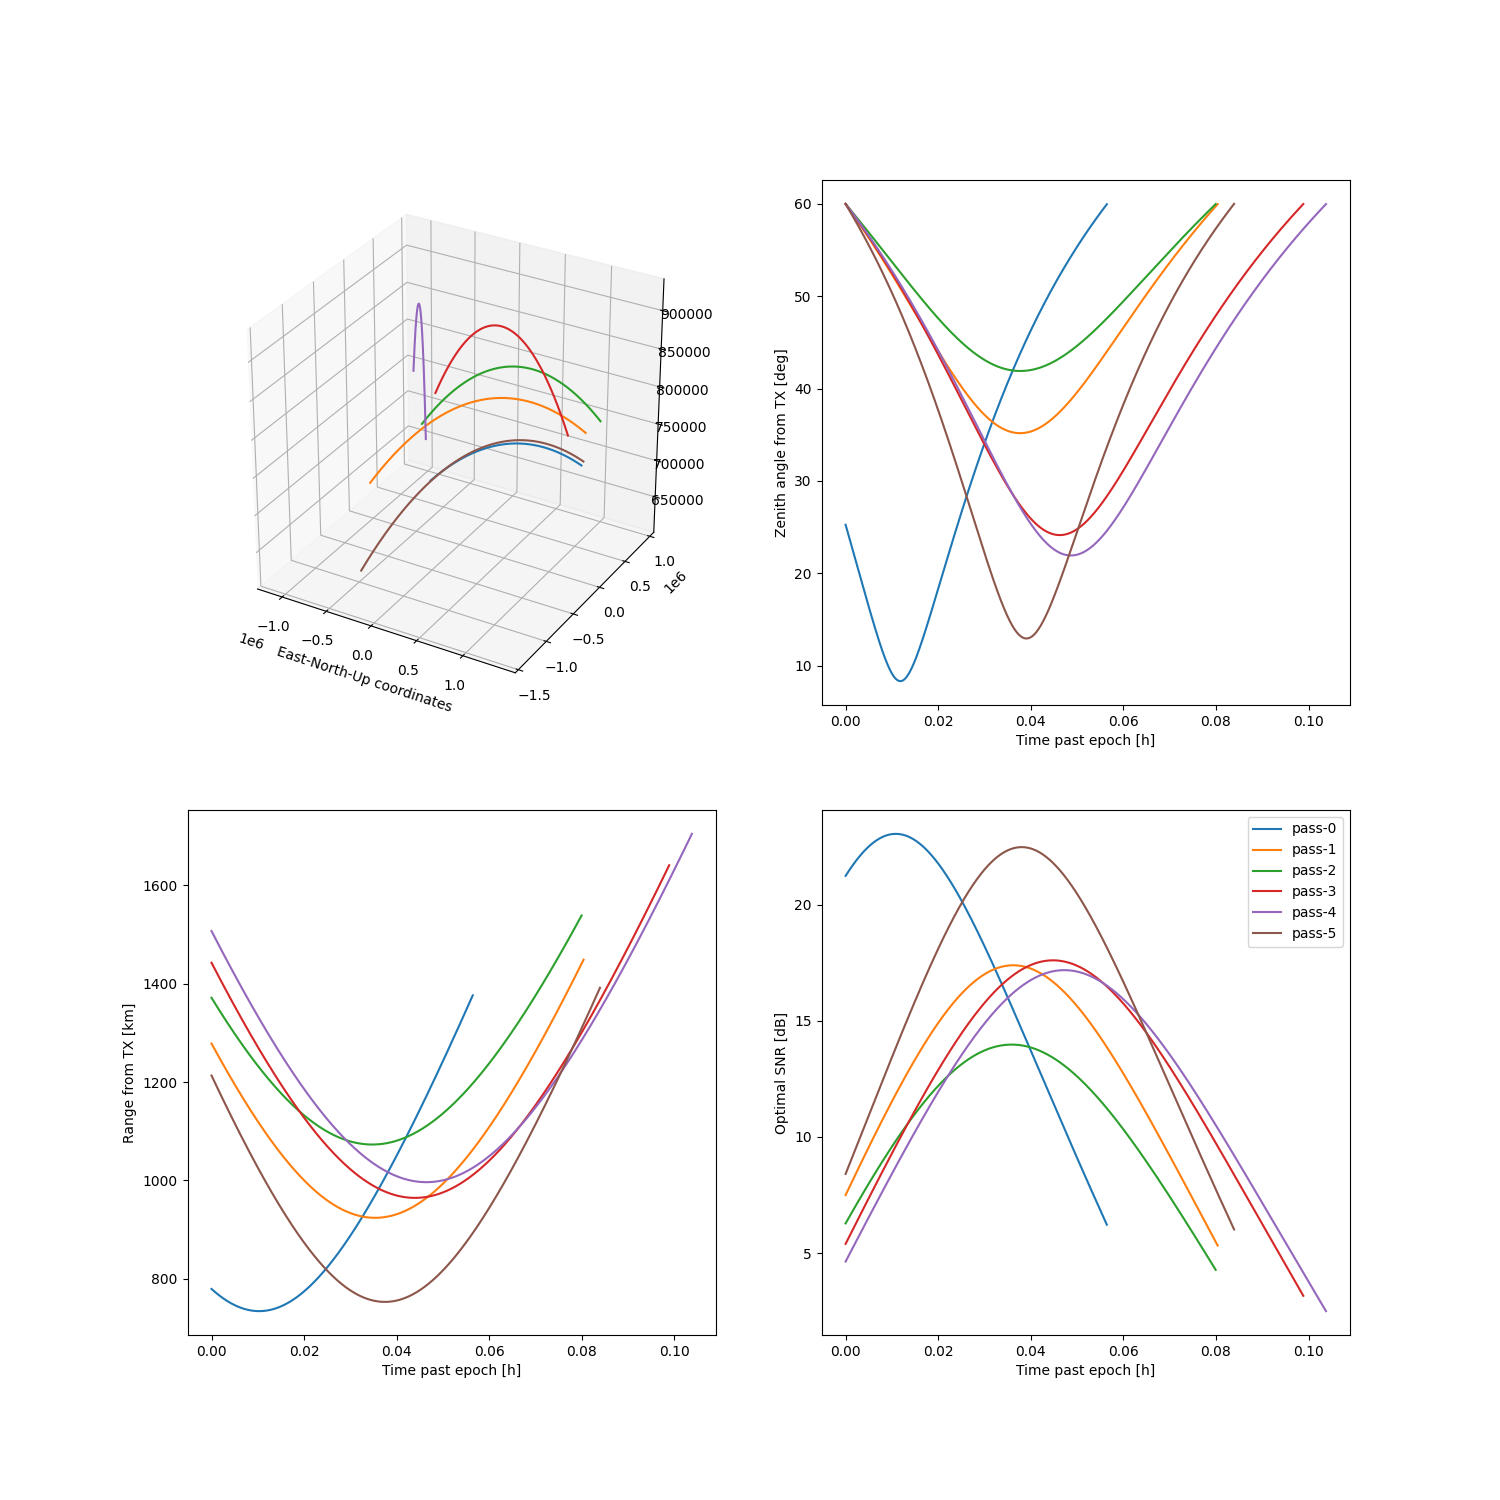
for pi, ps in enumerate(passes[0][0]):
zang = ps.zenith_angle()
snr = ps.calculate_snr(eiscat3d.tx[0], eiscat3d.rx[0], diameter=0.05)
axes[0][0].plot(ps.enu[0][0,:], ps.enu[0][1,:], ps.enu[0][2,:], '-', label=f'pass-{pi}')
axes[0][0].set_xlabel('East-North-Up coordinates')
axes[0][1].plot((ps.t - ps.start())/3600.0, zang[0], '-', label=f'pass-{pi}')
axes[0][1].set_xlabel('Time past epoch [h]')
axes[0][1].set_ylabel('Zenith angle from TX [deg]')
axes[1][0].plot((ps.t - ps.start())/3600.0, ps.range()[0]*1e-3, '-', label=f'pass-{pi}')
axes[1][0].set_xlabel('Time past epoch [h]')
axes[1][0].set_ylabel('Range from TX [km]')
axes[1][1].plot((ps.t - ps.start())/3600.0, 10*np.log10(snr), '-', label=f'pass-{pi}')
axes[1][1].set_xlabel('Time past epoch [h]')
axes[1][1].set_ylabel('Optimal SNR [dB]')
axes[1][1].legend()
plt.show()
Total running time of the script: ( 0 minutes 59.897 seconds)